Friday, December 30, 2005

Beginner's Guide To Search Engine Optimization (SEO)

Business owners are starting to notice their company's web site is not in the top ten search results on Google. They are finally starting to recognize the value good search engine rankings provide, and they are wondering why their web sites are not showing up in Google's search results. However, it seems many are looking for free advice on how to get their web site into the top ten.

This article will show you where to get free advice on how to get your web site to the top of the search results.

However, in trying to achieve top search rankings, you should be aware of several hurdles you'll need to overcome. For example:

1) There are only 10 top ten spots, and in many cases hundreds, if not thousands of businesses are trying to occupy those top ten spots. There is no magic formula that will put you ahead of your competition. Getting there, or even coming close, involves creating a viable search engine strategy, and a lot of time and hard work to implement that strategy.

2) Most web sites are poorly designed for achieving a high position in search results. While the web site might look good, have wonderful graphics (maybe even some eye-catching Flash animations), and be driven by powerful database software--it does not have what it takes to attract top search rankings. The point is, someone who is an outstanding web designer, does not necessarily know how to make a web site that will rank well in search results.

So what do you do? I recommend reading The Beginner's Guide To Search Engine Optimization. It is free and available online. It discusses topics such as how to do keyword research, the critical components of search engine optimization, and how to build a web site that will attract traffic.

Thursday, December 29, 2005

Flock - The Blogging Browser

I can't exactly say how I learned about Flock. I think I read about it in a blog this past week, or maybe it was an article in a newsletter. In any case I downloaded it, started using it, and liked it.

Flock is a new browser. It is called a "social browser by its creators, What's a social browser? Flock is designed to facilitate social activities on the web, such as blogging, collaborating and sharing photos. For example, I'm using Flock now to write this, and I like what I see. Using Flock is a lot more convenient and easier than logging into blogger.com. Once Flock has been set up, I just click on the "blog" button and start writing.

Although you can download and use Flock, it is currently only available as a development preview. I'm using version 0.5pre. I have encountered a few glitches, but nothing serious. For example, I've somehow managed to use two fonts in this post and I can not see a way to change fonts so the entire post will have a uniform font.

Overall I think Flock is going to be a big hit, and will be a driving force making blogging even bigger than it now is.

Postscript: Things did not go well when I tried to save this post. Flock reported that it had ecountered a problem and it had saved the post as a draft. My guess is that Blogger's captcha prevented what I wrote from being posted. When I logged into my blogger.com account, I found five copies saved as drafts--with none posted. If the post was stopped by the captcha, I'm all for retaining the captcha. I'll just log onto Blogger later and save the drafts as posts.

Also, now that I can look at the HTML I see that styles were added to create the different fonts I was seeing. However, these fonts are not showing up online when I save this post. I'm wondering if I picked up the styles when I did a copy and paste on a word I needed correctly spelled.

But, in spite of these problems, Flock makes blogging so easy, that--once the bugs are fixed--this is the browser to use in 2006... and I'll be continuing to use it from now on.

Monday, December 12, 2005

Analyzing Your Server Logs - Pt 2

This is part two in a series of posts that look at the marketing information available in your web site log reports. I am using the terminology used by the Web Trends Log Analyzer software. Other software uses similar terminology.

Unless there is a specific problem I’m researching, when I look at web log reports I go directly to the information that has the highest ROI. This is what I ,ook at:

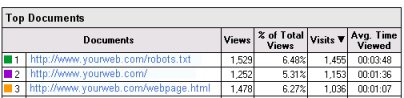
Top Documents – This is list of the most frequently accessed pages on your web site. Below you see the top three pages listed in a Web Trends report.

The Top Documents listing tells you how many times the page was viewed and how many unique visitors there were. The number of views will always be higher than the number of visits. Someone who visits a page twice will be counter as two views, but just one visitor.

This listing also shows the average amount of time a visitor has the page displayed on their monitor. These times can give you a rough idea of how much of the information on the page is being read. This information is very useful when combined with information from other lists, as I’ll describe shortly.

For my web sites the robots.txt file is usually at the top of the list. This file is used to tell search engine spiders how you want them to interact with your web site.

The other page I always expect to find at the top of the listings is the home page.

Top Entry Pages – This list shows the pages most frequently used to enter your web site. These are the pages that provide the first impression for your web site. These are very likely the most important pages on your web site. I focus a major portion of my efforts on these pages. They need to have a clear, concise, compelling message so that visitors quickly understand what you are selling/offering and why they should read more. You typically have less than ten seconds to capture the visitor’s attention and convince them your web site is worth their time.

Top Exit Pages – These are the most common last pages viewed just before a visitor leaves your web site. You can expect the robots.txt file to be near the top of the list, and it may be ignored. Your home page will also probably be near the top of the list.

The pages on this list are your last chance to make a good impression before someone leaves your web site. While you may want to keep people on your web site forever, the reality is that everyone has to leave sometime. Look at these pages to determine whether it makes sense for someone to leave through the page, or are they leaving at the beginning or in the middle of a series of pages. If your “thank you for making a purchase” page is near the top of the list, you have an incredible web site. That is a very appropriate exit page. However, in most cases the “thank you” page will not even make the list.

Single Access Pages – These are pages people use to enter your web site, however, they only look at this one page and then leave. Compare this list with the “Top Documents” list to find out how long people are looking at these pages. If the times are very short, people are most likely looking for something other than what the page offers. You should investigate why people are coming to the page and where they are coming from. If the times are longer (ten seconds or greater), there are three options:

1) The page may be offering what they want in general, but they are not finding the specific information they want, or they don’t know what to do next. You may need to look at improving navigation or your call to action.

2) The page is offering exactly what they wanted, their question was answered so they left. If your goal is to answer visitor’s questions, you can then classify this page as effective. For example, if this is a page with contact information about your company, most likely the visitor got the phone number or address they needed and then they left.
3) The page is poorly written, or the information is presented in a confusing fashion. You may need to look at your page design and copywriting.

Top Paths Through Site – This provides a list of the most common series of pages people viewed while visiting your web site. A path may have a single page, or multiple pages. This gives you an idea of what people did during their visit.

Each of the lists also includes a percentage that gives the percentage of total visitors each page represents. This is significant information that helps you judge the relative importance of the rankings. A page at the top of the Single Access list, that has 1% of your traffic is much less important than a Single Access page that has 10% of the visitors.

These five lists provide a wealth of information about what is happening on your web site. Combine the information from several lists, looking at pages that appear on more thanone list, to get a better understanding of how visitors are reacting to your web pages. For example, if some of your Top Documents are also the top Single Access pages, then you have a lot of wasted traffic visiting your web site--people are visiting and then leaving.

Keep in mind that as you make changes to you web site the pages on these list will change. The pages that appear on these lists will also change as a result of compeditive changes and changes in the market. You need to be reviewing you web logs regularly and taking action on the information the provide.

Friday, December 09, 2005

Analyzing Your Server Logs

Your web logs are an important source of marketing information.

Looking at raw log data is meaningless unless you are a technical geek. However, most hosting companies provide free online log analysis using software such as Webalizer or Analog. Check your hosting provider’s help pages for information describing how you can access your log information.

Web site logs provide a lot of information about what’s happening on your web site. Let’s take a look at a few of the more important items:

The first thing you’ll see is an overview of the activity on your web site. The following is typical:


Monthly Statistics for November
2005
Total Hits1283748
Total Files995728
Total Pages182778
Total Visits59002
Total KBytes11670808
Total Unique Visitors34098
Total Unique Referrers4149

Avg Max
Hits per Hour177613453
Hits per Day4279168512
Files per Day3319055594
Pages per Day60928173
Unique Visits per Day11372438
KBytes per Day389026942717


Here is what each line means:

Total Hits: A “hit” is recorded any time a file of any type is requested. For example, if a web page includes three images, a hit will be counted when the web page is requested. An additional three hits will be counted as the three images are requested. Thus when a visitor looks at that page, four hits are counted.

Total Files: This records the number of files that are successfully downloaded. If everythere were perfect, the “Total Files” would equal the “Total Hits”—every file that was requested would be successfully downloaded. But in reality everything does not work perfectly and the “Total Files” will always be less than the “Total Hits”.

Total Pages: This shows the total number of complete web pages that were accessed.

Total Visits: A visitor will typically look at several pages on the web site. The web server keeps track of visitors and only counts them once, even if they leave the web site and return a few minutes later. However, if they leave and do not return for a day or two, that second visitor will typically be counted as a new visit. An interesting metric is to track the number of pages per visit (Total Pages/Total Visits). The larger this number, the better, because it means visitors are staying on your site and looking at more pages.

Total Kbytes: The total number of kilobytes downloaded from the web site.

Total Unique Visitors: The web server attempts to identify people who visit the web site, leave and then return again, so that each person is counted only once. Although not entirely accurate, this is probably one of the more important data points. It gives you a rough idea of home many people visit your web site.

Total Unique Referrers: This number shows you the number of pages that could be identified as having a link to your web site which people clicked on to go to a page on your web site. This number includes pages within the web site itself, so looking at what’s behind this number is important. We’ll talk about that in a future post.

Per Day Data: The “Per Day” day breaks down the above information so you can see both the average and maximum numbers. You usually can see the specific daily numbers, if you wish to see daily trends.

Thursday, December 08, 2005

Search Engine Saturation

Search engine saturation is a metric that shows how many of the pages in your web site a search engine has found. There are free online tools that will measure web site saturation. My favorite is MarketLeap

Another site that offers a free tool to measure saturation is PageRank.net

There are many web sites that offer a tool similar to what you’ll find on PageRank.net. I prefer the MarketLeap tool because it maintains a saturation history allowing you to see trends. Each time you measure saturation it stores another data point. Checking your saturation once a month is a good way to build up a useful trend report.

Monitoring your search engine saturation helps identify problems that may be preventing a search engine from seeing your complete site, such as poor navigation, poor page design or even possible banning of the site.

Low Page Counts

For example, I’ve just starting working on a web site that has over 50,000 pages. The MarketLeap saturation report shows this site as having 234 pages in the Google index. There appears to be a problem, or actually several problems. Here are three:

a) About 35,000 of the pages require the visitor to enter a password. This prevents Google from indexing those pages. The password requirement is just ensure the visitor has read the terms of use. The site owner would like Google to index the complete web site.

b) The web site is set up like a directory. There is a manual navigation system that provides “index” pages, each with 600 links. Although these are all internal links, this is rather unusual and Google may be seeing this as a link farm.

c) The link text is not meaningful. Links are labeled with just an alphabetical range (a-ad, ad-ah, ah-am, etc.) or with page numbers (page 1, page 2, page 3, etc.).

High Page Counts

The page count reported by a tool for measuring saturation will often exceed the total number of pages on your web site. For example, I have a web site that has about 3,000 pages, but saturation tools report that Google has over 10,000 pages in its index. What is going on?

You can search for the pages in Google by using the following in the Google search box (with no spaces):

site:www.website.com/

The problem is, although it will tell you how many pages are in the index, you can only see the listing for a limited number of those pages.

Part of the reason for the high number of pages is that search engines will list the same page multiple times using different URLs. For example, here are for URLs for the same page:

www.yoursite.com/
www.yoursite.com/index.htm
yoursite.com
yoursite.com/index.html

Because you have no way to know how many duplicate pages are in the search engine’s index, you can not take saturation numbers as being absolute. If there is a big discrepancy, such as in my first example, you know there is a problem. However, in most cases saturation numbers should be considered as relative numbers that serve as a guide to tell you whether your saturation is improving or not improving. For example, if you’ve been adding pages to your web site, but your saturation is decreasing, there is a problem.

Monday, December 05, 2005

Search Engine Visibility

What is search engine visibility?

I frequently see the terms “saturation” and “visibility” used interchangeably. However, I feel there is a significant difference. Visibility is a measure of how visible your _______ (fill in the blank) is in the search results. In its simplest form, the higher you rank in the search results, the more visible you are. Taking a defintion of internet visibility to a higher level, internet visibility has to do with where people first look when a page of search results are displayed. This is measured using eye tracking studies and is typically found to be the upper left of the page—which is where the top ranked search results are usually located.

I intentionally left a "fill in the blank" space in the above paragraph. When visibility is measured, it is important we be aware of what we are measuring and what we need to be measuring. In a moment we’ll take a look at some of the possibilities we can use to fill in that blank, but first, how do we measure visibility?

Traditionally visibility measurements are based on the first three pages of search results. I base my visibility metrics on the first two pages (top 20) search results. Although it gives a lower visibility rating, I feel this is more realistic as few people go beyond the second page of search results.

To calculate a visibility score, assign points to each position in the search results. If you are looking at the top 20 search results, the #1 result is worth 20 points. The #2 position is worth 19 points. The third ranked result is 18 points… and so on.

Conduct a search, in each search engine you are monitoring, for the same key word or phrase. The visibility metric is based on just one web page. Find your highest ranked web page in the search results, and record the number of points based on the position of that page. If it is in the #21 position or higher, it gets no points. Here’s an example:

Let’s say the search phrase is "wall clocks" and these are the search results:

Search EngineTop Ranked PagePoints
Google912
Yahoonone0
MSN417
Ask156
TOTAL Points
35
Visibility Ranking
43.8%

The visibility ranking (the percentage) is calculated by dividing the total points by the total number of possible points, which is 80 (4 times 20) in this case.

This gives the visibility for a specific key word or phrase. You can then check a number of key words and phrases, and average them to get an overall visibility score.

There are a variety of ways to measure visibility.

Web Site Visibility: This is visibility in it’s simplest form. The objective is to measure the visibility of a specific web site. When you check the search results you only give points to the top ranked page from the specific web site that is being evaluated. This type of visibility can be measured manually or using automated tools.

Web Visibility: If you have more than one web site (see previous post discussing mini-sites) you may want to measure your web visibility based on all of your web sites. In this measurement you give points to your highest ranked page from any of your web sites for each key word/phrase. This type of visibility can be measured manually or using custom automated tools.

Organization Visibility: This measure of visibility looks at how well your organization shows up in search results. It takes into account any page that benefits your organization. This includes pages from your web site(s), as well as press releases, blog posts, articles, pages from dealer web sites, trade show pages and any other web pages you judge are of significant benefit to you. For pages that are not on your web site(s), these should be pages that are exclusively about your organization and that lead visitors directly to your web site. In other words, they must directly contribute to achieving your internet objectives, not just be pages that mention your company name. This type of visibility can only be measured by manually by having someone look at search results.

Product Visibility: This measure of visibility looks for pages that are about a specific product or service. The top ranked page that is about the targeted product or service, and which provides significant benefit, is the page that is counted. This could be a page from the company web site(s), a press release, an advertisement, blog post or a dealer’s page.

Internet visibility is a valuable metric. You should be measuring, and tracking historical data for search engine visibility for various types of visibility, depending on your internet marketing goals. The purpose of these metrics is to ensure that you have pages in the locations in search results that where the greatest number of people will see the links. Use these metrics to ensure you have good internet visibility based on your targeted internet marketing goals, and to spot visibility problems as early as possible.

Friday, December 02, 2005

Mini-Sites Effect Main Web Site Rankings

I was going to talk about visibility of key phrases today, but I thought I should cover another topic first, mini-sites.

A mini web site is a small web site that is targeted at a specific subject. For example, a manufacturer might have a main web site that covers all their products and services, and then a series of small web sites for each product. I have a client who does exactly that. The mini-sites are easy for the sales staff to refer customers to for information on specific products. For example, if the customer is interested in product XYZ, the sales person can refer them to XYZ.COM.

The mini-sites also make it easy for the customer to find information about a product without getting distracted by information that may only apply to an unrelated product.

In addition, because this client does not want to miss out on cross-selling opportunities, there is some cross linking between the mini-sites, and all the mini-sites link to the main web site.

Since the Google Jagger update I’ve noticed that it is becoming common for the client’s mini-sites to replace the main site in Google search results. It appears that the overall theme of the web site is playing a larger role in determining relevance. This makes sense because the targeted content of the mini-site is highly relevant to the search. While the similar content on the main web site is buried among 25 other types of products. The downside is that for some key phrases the mini-site typically ranks lower than the main web site did for the same key phrase. This is probably because it does not have the abundance of inbound links that the main web site has.

In my next post I’ll talk about why this is important when measuring key phrase visibility.

Thursday, December 01, 2005

Montitoring Search Results

This begins a series of postings on methods for monitoring how well you are doing in the search engine results pages (SERPS). I’ll first be looking at direct measurement of search engine results, then I’ll discuss measuring how well marketing objectives are being achieved. I’ll be focusing on methods that can be used by anyone, large companies, small firms or individuals, and which require a minimal number of software tools.

DATA COLLECTION

I manually collect data about my client’s web sites every month. This means I perform a series of searches using the targeted keywords, and record the results in a spreadsheet. By collecting data manually I do not abuse the search engine’s limits on data mining, but more importantly it gives me an opportunity to get an overall view of the search results for each key phrase. I find that I notice things about my web sites, and about competitors web sites, that are not necessarily revealed by the data.

In the past I would collect data on ten search engines. Since the consolidation of search engine ownership, I now usually monitor just five search engines:

Yahoo
Google
MSN
Teoma
Ask (B to B) or AOL (consumer)

In some cases I add one or two other search engines, including some meta search engines, based on the client’s target market, and their customers search behavior.

The number of key phrases I use varies by client from five, up to seventeen.

As I search for each key phrase I record each instance of a web site that benefits the client in a program I've created. You can also use a spreadsheet as shown below. The standard practice is to look at the top 30 search results, but since most searchers don't even go past the first page, I only look at the top 20 search results for each key phrase. I record the position of the web page in the search results and the root URL of the web site.

Monitoring search results

What is a web site that benefits the client?

Any web site that benefits the client. This, of course, includes their web site. But it also includes web sites that have one of their press releases or an article about the client or one of their products. It may include dealers who carry the client’s products, if the dealer site does not steer customers to a competitive product. It could include blog posts, discussion forms, trade show sites and supplier web sites. Any web page that truly delivers value to my client is counted.

What about ads?

Whether or not to include ads as a part of the search results is a judgment call. If I think the search result page is designed such that a typical visitor is likely to consider the ads as a part of the search results, I count the ads. Thus if a search result page that has five paid ads at the top and ten organic search results, I may count it as having 15 search results. When I go to the next page I’ll only look at the top five “search” results on that page—which may all be paid ads.

Next – Determining Keyword Visibility